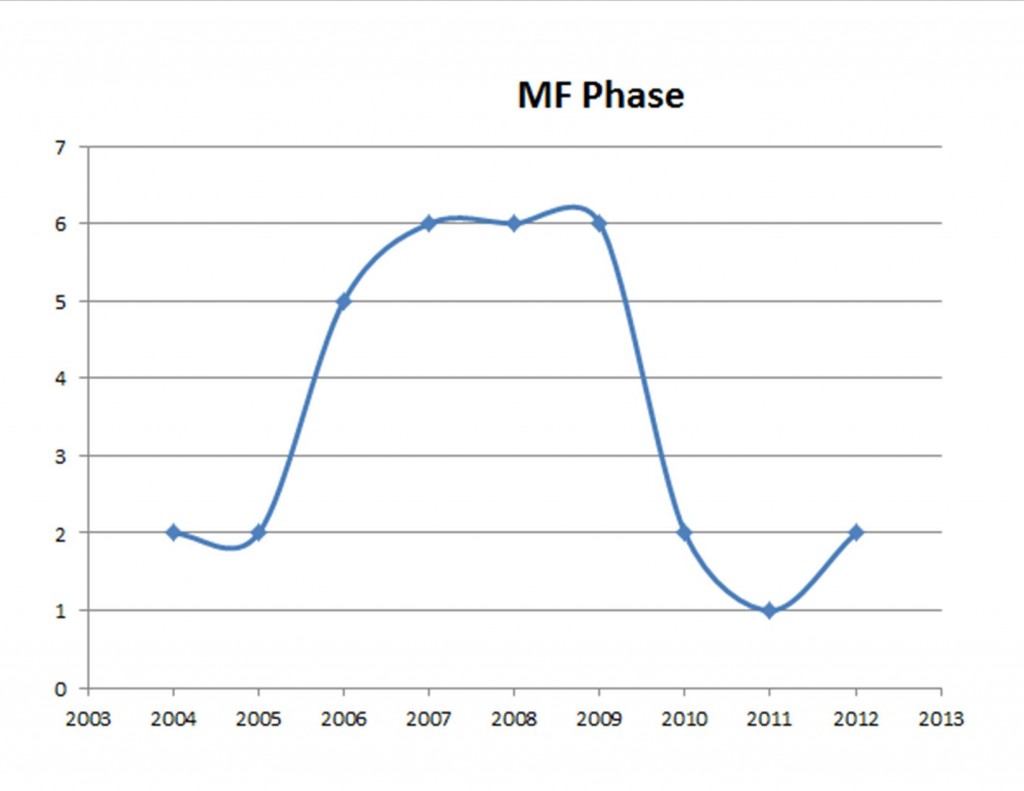
The graph below depicts the historical phases of the Multi Family Market in the Real Estate Market Cycle in Tampa Bay from 2004 to 2012
Indications are that the Multi Family market is now in the Recovery Phase of the Cycle
DIRECTION = UP DIRECTION = DOWN
0 to 1— RECOVERY — Phase 1 6 to 5— HYPERSUPPLY — Phase 1
1 to 2— RECOVERY — Phase 2 5 to 4— HYPERSUPPLY — Phase 2
2 to 3— RECOVERY— Phase 3 4 to 3— HYPERSUPPLY — Phase 3
3 to 4— EXPANSION— Phase 1 3 to 2— RECESSION — Phase 1
4 to 5— EXPANSION— Phase 2 to 1— RECESSION — Phase 2
5 to 6— EXPANSION— Phase 3 1 to 0— RECESSION — Phase 3
The theoretical Real Estate Cycle is often depicted in the shape of a normal distribution. In practice, the shape may be different.


Write a Comment